JavaScript数据可视化三大数据图

柱形图(bar)

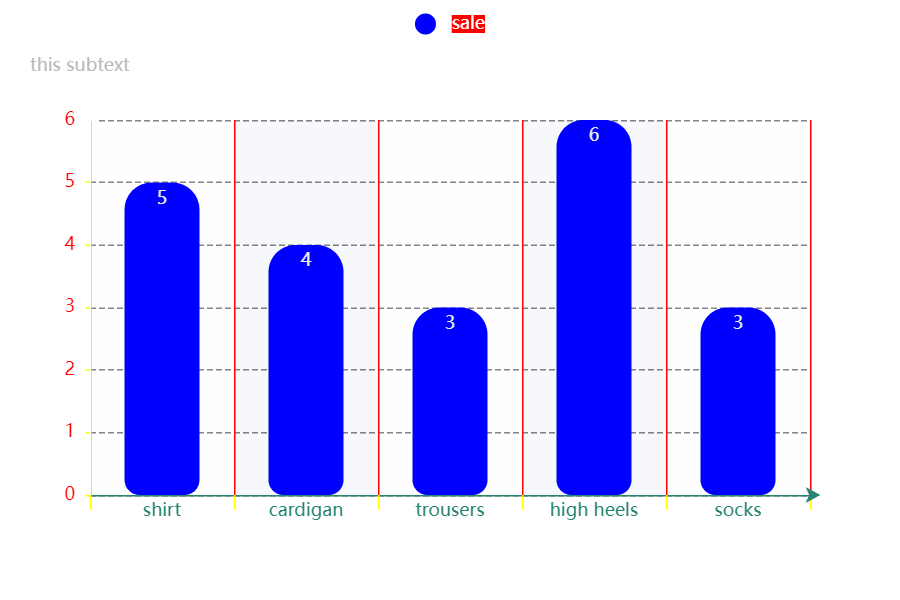
简单柱形图:

这是图片

1
2
3
4
5
6
7
8
9
10
11
12
13
14
15
16
17
18
19
20
21
22
23
24
25
26
27
28
29
30
31
32
33
34
35
36
37
38
39
40
41
42
43
44
45
46
47
48
49
50
51
52
53
54
55
56
57
58
59
60
61
62
63
64
65
66
67
68
69
70
71
72
73
74
75
76
77
78
79
80
81
82
83
84
85
86
87
88
89
90
91
92
93
94
95
96
97
98
99
100
101
102
103
104
105
106
107
108
109
110
111
112
113
114
115
116
117
118
119
120
121
122
123
124
125
126
127
128
129
130
131
132
133
134
135
136
137
138
139
140
141
142
143
144
145
146
147
148
149
150
151
152
153
154
155
156
157
158
159
160
161
162
163
164
165
166
167
168
169
170
171
172
173
174
175
176
177
178
179
180
181
182
183
184
185
186
187
188
189
190
191
192
193
194
195
196
197
198
199
200
201
202
203
204
205
206
207
208
209
210
211
212
213
214
215
216
217
218
219
220
221
<!DOCTYPE html>
<html lang="en">
<head>
<meta charset="UTF-8">
<meta name="viewport" content="width=device-width, initial-scale=1.0">
<title>Document</title>
<style>
.bar{
width: 600px;
height: 400px;
background-color: aqua;
}
</style>
</head>
<script src="echarts.js"></script>
<body>
<div class="bar"></div>
<script>
let box = document.querySelector(".bar")
console.log(box)
let myChar = echarts.init(box)
let option = {
title: {
text: "this my first chart",
subtext: "this subtext",
textStyle: {
color: "#fff"
},
subtextStyle: {
color: "#bbb"
},
padding: [10,0,10,20]
},
legend: {
type: 'plain',
top: "1%",
selected:{
"sale": true,
},
textStyle:{
color: "#fff",
backgroundColor: "pink"
},
tooltip: {
show: true,
color: "red"
},
data: [{
name: "sale",
icon: "circle",
textStyle: {
color: "#fff",
backgroundColor:"red"
}
}]
},
tooltip:{
show: true,
trigger: "item",
axisPointer: {
type: 'shadow',
axis: 'auto'
},
padding: 5,
textStyle:{
color:"#807900"
}
},
grid:{
show: false,
top: 80,
containLabel: false,
tooltip:{
show:true,
trigger:"item",
textStyle:{
color:"#298900"
}
}
},
xAxis:{
show:true,
position:"bottom",
offset: 0,
type:'category',
name:"sort",
nameLocation: "end",
nameTextStyle:{
color:"#fff",
padding: [10,0,10,5]
},
nameGap: 10,
nameRotate: 0,
axisLine:{
show:true,
symbol:['none','arrow'],
symbolSize:[8,10],
symbolOffset:[0,7],
lineStyle:{
color: "#278572",
width:1,
type: "solid"
},
},

axisTick:{
show: true,
inside: false,
length:10,
lineStyle:{
color:"yellow",
width: 1,
type:"solid"
}
},
axisLabel:{
show: true,
inside:false,
rotate:0,
margin:5
},
splitLine:{
show: true,
lineStyle:{
color:"red",
width:1,
type:"solid"
},
},
splitArea:{
show:true,
},
data: ["shirt","cardigan","trousers","high heels","socks"]
},
toolbox:{
show:true,
feature:{
mark:{show:true},
saveAsImage:{show:true}
}
},

yAxis:{
show:true,
position:"left",
offset:0,
type:'value',
nameLocation:'end',
name:"sale",
nameTextStyle:{
color:"#fff",
padding:[5,10,0,5]
},
nameGap:10,
nameRotate:0,
axisLine:{
show:true,
symbol:['none','arrow'],
symbolSize:[8,10],
symbolOffset:[0,7],
lineStyle:{
color:"#fff",
width:1,
type:"solid"
}
},
axisTick:{
show:true,
inside:false,
length:3,
lineStyle:{
color:"yellow",
width:1,
type:"solid"
}
},
axisLabel:{
show:true,
inside: false,
rotate:0,
margin:10,
color:"red"
},
splitLine:{
show:true,
lineStyle:{
color:"#666",
width:1,
type:'dashed'
}
},
splitArea:{
show:false,
}
},
series: [
{
name: "sale",
type: "bar",
legendHoverLink:true,
label:{
show:true,
position:'insideTop',
rotate:0,
color:"#eee"

},
itemStyle:{
color:"blue",
barBorderRadius:[18,18,10,10]
},
barWidth:'50',
barCategoryGap:'20%',
data: [5,4,3,6,3,2]
},
]
};
myChar.setOption(option)
</script>
</body>
</html>

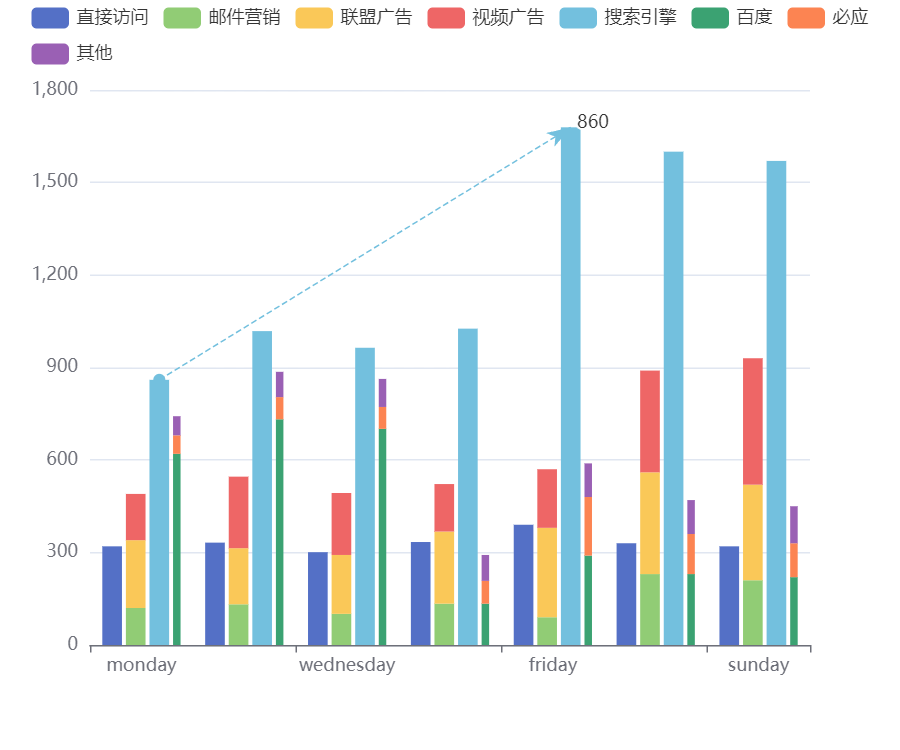
堆积柱形图:

这是图片

1
2
3
4
5
6
7
8
9
10
11
12
13
14
15
16
17
18
19
20
21
22
23
24
25
26
27
28
29
30
31
32
33
34
35
36
37
38
39
40
41
42
43
44
45
46
47
48
49
50
51
52
53
54
55
56
57
58
59
60
61
62
63
64
65
66
67
68
69
70
71
72
73
74
75
76
77
78
79
80
81
82
83
84
85
86
87
88
89
90
91
92
93
94
95
96
97
98
99
100
101
102
103
104
105
106
107
108
109
110
111
112
113
114
115
116
117
118
119
120
121
122
123
124
125
126
127
128
129
130
131
132
133
134
135
136
137
138
139
140
141
142
143
144
145
146
147
148
149
150
<!DOCTYPE html>
<html lang="en">

<head>
<meta charset="UTF-8">
<meta name="viewport" content="width=device-width, initial-scale=1.0">
<title>Document</title>
<script src="echarts.js"></script>
<style>
.bar {
width: 800px;
height: 500px;
background-color: aqua;
}
</style>
</head>

<body>
<div class="bar"></div>
<script>
let box = document.querySelector(".bar")
let myChart = echarts.init(box)
console.log(myChart)
let option = {
tooltip: {
//显示布局
trigger: "axis",
//鼠标移动到数据时的样式为阴影
axisPointer: {
type: "shadow"
}
},
legend: {
data: ["直接访问", "邮件营销", "联盟广告", "视频广告", "搜索引擎", "百度", "谷歌", "必应", "其他"]
},
toolbox: {
show: true,
orient: "vertical",
x: "right",
y: "center",
feature: {
mark: {
show: true,
},
dataView: {
show: true,
readOnly: false
},
magicType: {
show: true,
type: ["line", "bar", "stack", "tiled"],

},
restore: {
show: true
},
saveAsImage: {
show: true
}
}
},
calculable: true,
xAxis:[{
type:"category",
data:["monday","tuesday","wednesday","thursday","friday","saturday","sunday"]
}],
yAxis:[{
type:'value'
}],
series:[{
name :'直接访问',
type:'bar',
data:[320,332,301,334,390,330,320],
markLine:{
itemStyle:{
normal:{
lineStyle:{
type:'dashed'
}
}
},
data:[
[{type:'min'},{type:'max'}]
]
}
},
{
name:'邮件营销',
type:'bar',
stack:'广告',
data:[120,132,101,134,90,230,210]
},
{
name:'联盟广告',
type:'bar',
stack:'广告',
data:[220,182,191,234,290,330,310]
},
{
name:'视频广告',
type:'bar',
stack:'广告',
data:[150,232,201,154,190,330,410]
},
{
name:'搜索引擎',
type:'bar',
data:[860,1018,964,1026,1679,1600,1570],
markLine:{
itemStyle:{
normal:{
lineStyle:{
type:'dashed'
}
}
},
data:[
[{type:'min'},{type:'max'}]
]
}
},
{
name:'百度',
type:'bar',
barWidth:5,
stack:"搜索引擎",
data:[620,732,701,134,290,230,220]

},
{
name:'必应',
type:'bar',
stack:'搜索引擎',
data:[60,72,71,74,190,130,110]
},
{
name:'其他',
type:'bar',
stack:'搜索引擎',
data:[62,82,91,84,109,110,120]
}

]
}
myChart.setOption(option)

</script>
</body>

</html>

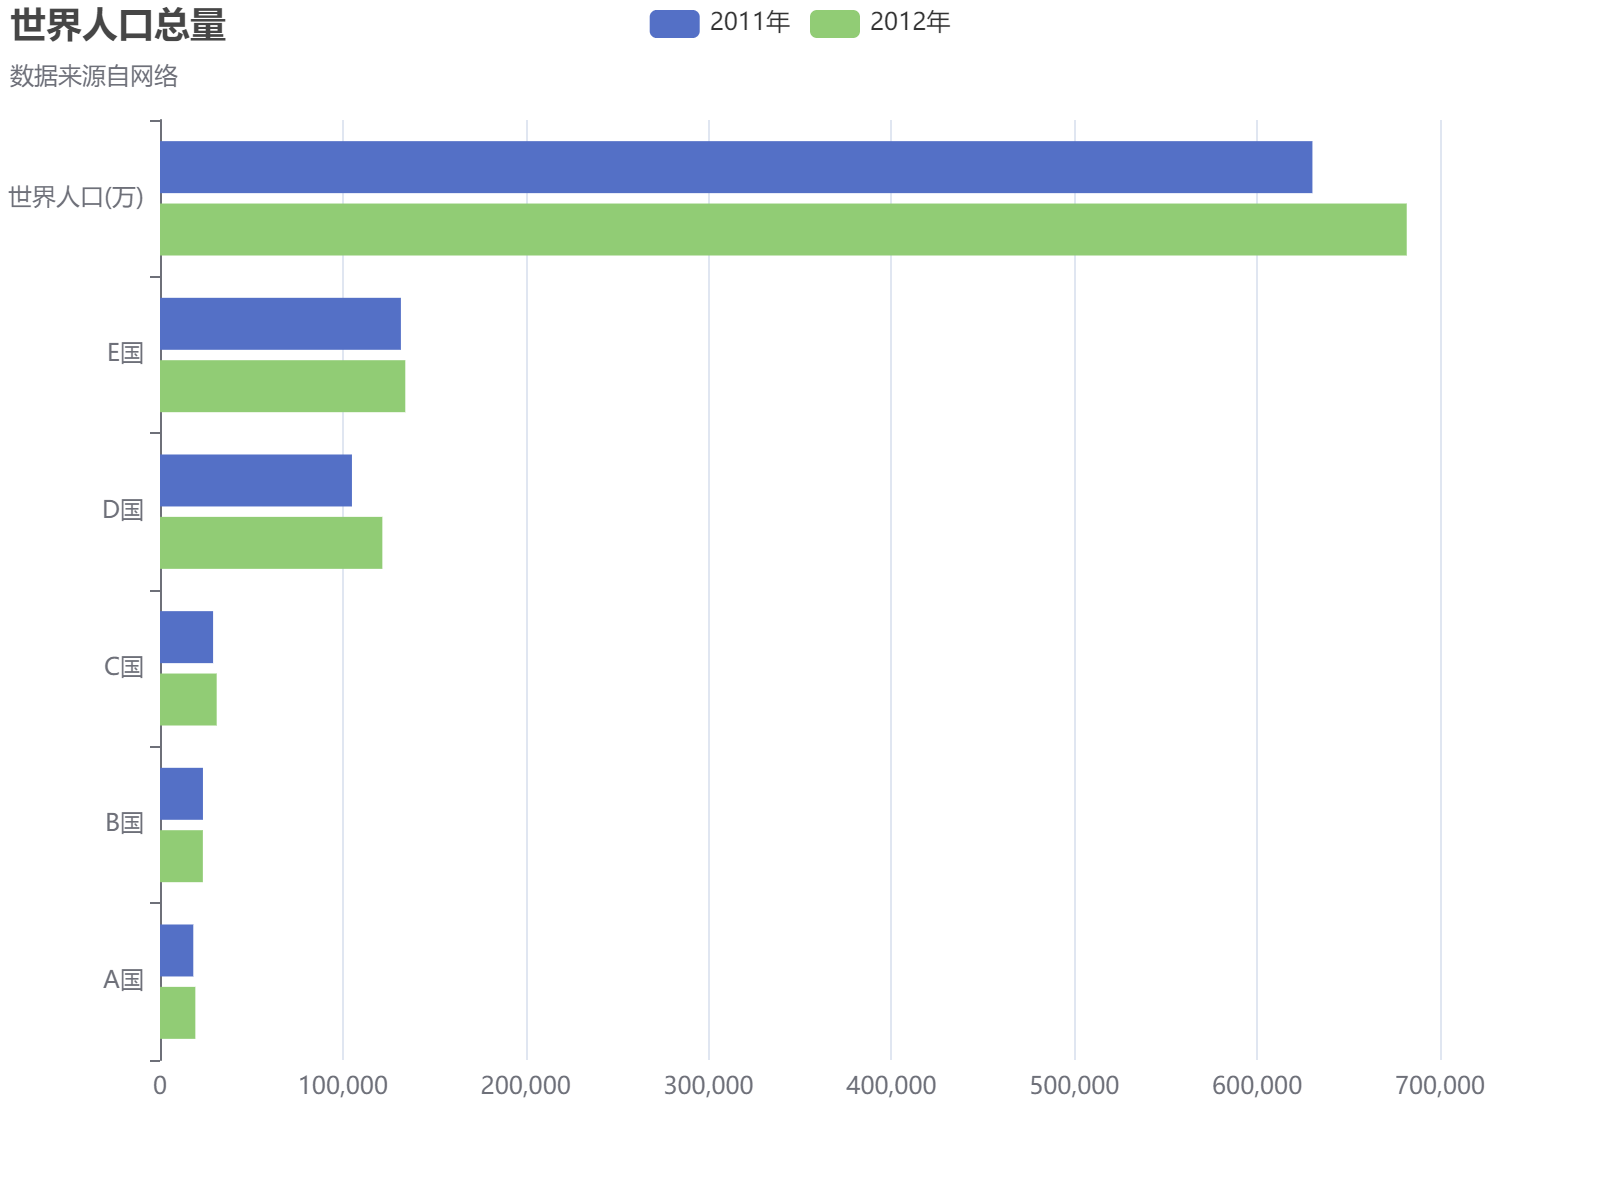
条形图:

这是图片

1
2
3
4
5
6
7
8
9
10
11
12
13
14
15
16
17
18
19
20
21
22
23
24
25
26
27
28
29
30
31
32
33
34
35
36
37
38
39
40
41
42
43
44
45
46
47
48
49
50
51
52
53
54
55
56
57
58
59
60
61
62
63
64
65
66
67
68
69
70
<!DOCTYPE html>
<html lang="en">
<head>
<meta charset="UTF-8">
<meta name="viewport" content="width=device-width, initial-scale=1.0">
<title>Document</title>
<script src="echarts.js"></script>
<style>
.bar{
width:800px;
height: 600px;
background-color: aqua;
}
</style>
</head>
<body>
<div class="bar"></div>
<script>
let box = document.querySelector('.bar')
let myChart = echarts.init(box)
let option = {
title:{
text:'世界人口总量',
subtext:'数据来源自网络'
},
tooltip:{
trigger:"axis",
axisPointer:{
type:'shadow'
}
},
legend:{
data:["2011年","2012年"]
},
toolbox:{
show:true,
feature:{
mark:{show :true},
dataView:{show:true,readOnly:false},
magicType:{show:true,type:['line','bar']},
restore:{show:true},
saveAsImage:{show:true}
}
},
calculable:true,
xAxis:[{
type:'value',
boundaryGap:[0,0.01]
}],
yAxis:[{
type:'category',
data:['A国','B国','C国','D国','E国','世界人口(万)']
}],
series:[
{
name:'2011年',
type:'bar',
data:[18203,23489,29034,104970,131744,630230],
},
{
name:'2012年',
type:'bar',
data:[19325,23438,31000,121594,134141,681807]
}
]
}
myChart.setOption(option)
</script>
</body>
</html>

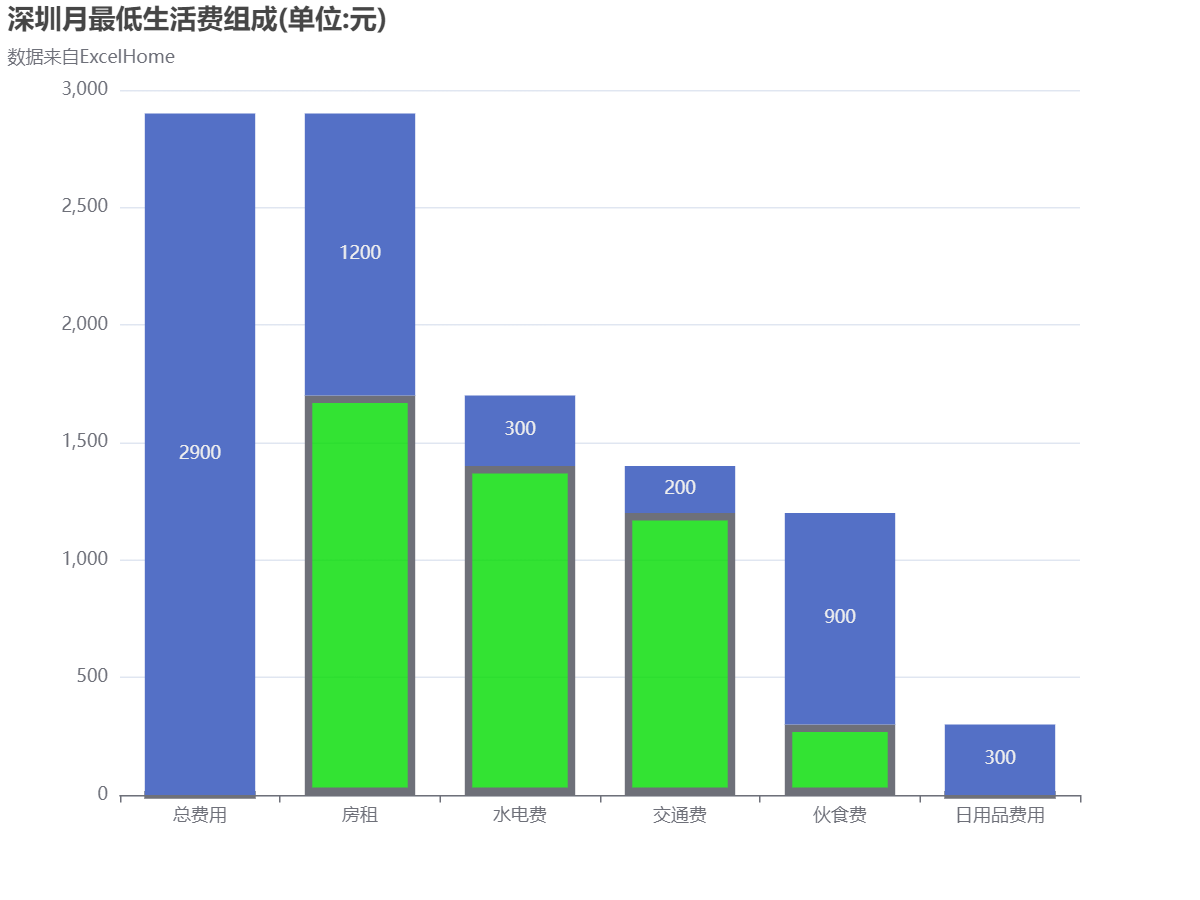
瀑布流:

这是图片

1
2
3
4
5
6
7
8
9
10
11
12
13
14
15
16
17
18
19
20
21
22
23
24
25
26
27
28
29
30
31
32
33
34
35
36
37
38
39
40
41
42
43
44
45
46
47
48
49
50
51
52
53
54
55
56
57
58
59
60
61
62
63
64
65
66
67
68
69
70
71
72
73
74
75
76
77
78
79
80
81
82
83
84
85
86
87
88
89
90
91
92
93
94
95
96
97
98
99
<!DOCTYPE html>
<html lang="en">

<head>
<meta charset="UTF-8">
<meta name="viewport" content="width=device-width, initial-scale=1.0">
<title>Document</title>
<script src="echarts.js"></script>
<style>
.bar {
width: 800px;
height: 600px;
background-color: aqua;
}
</style>
</head>

<body>
<div class="bar"></div>
<script>
let box = document.querySelector('.bar')
let myChart = echarts.init(box)
let option = {
title: {
text: '深圳月最低生活费组成(单位:元)',
subtext: '数据来自ExcelHome'
},
tooltip: {
trigger: 'axis',
axisPointer: {
type: 'shadow'
},
formatter: function (params) {
let tar = params[0]

return tar.name + '<br/>' + tar.seriesName + ':' + tar.value;
}
},
toolbox:{
show: true,
feature:{
mark:{show:true},
dataView:{show:true,readOnly:false},
restore:{show:true},
saveAsImage:{show:true}
}
},
xAxis:[{
type:'category',
splitLine:{show:false},
data:['总费用','房租','水电费','交通费','伙食费','日用品费用']
}],
yAxis:[{
type:'value'
}],
series:[{
name:'辅助',
type:'bar',
stack:'总量',
itemStyle:{
normal:{
// barBorderColor:'rgba(0,0,0,0)',
barBorderColor:"raba(20,20,0,0.5)",
barBorderWidth:5,
// color:"rgba(0,0,0,0)",
color:'rgba(0,220,0,0.8)'
},
//鼠标tach变色
emphasis:{
barBorderColor:'rgba(0,0,0,0)',
barBorderWidth:25,
color:'rgba(0,0,0,0)'
}
},
data:[0,1700,1400,1200,300,0]
},
{
name:"生活费",
type:'bar',
stack:'总量',
itemStyle:{
normal:{
//数据标签
label:{
show:true,
postion:"inside"
}
}
},
data:[2900,1200,300,200,900,300]
}
]

}
myChart.setOption(option)
</script>
</body>

</html>

折线图(line)

简单折线图:

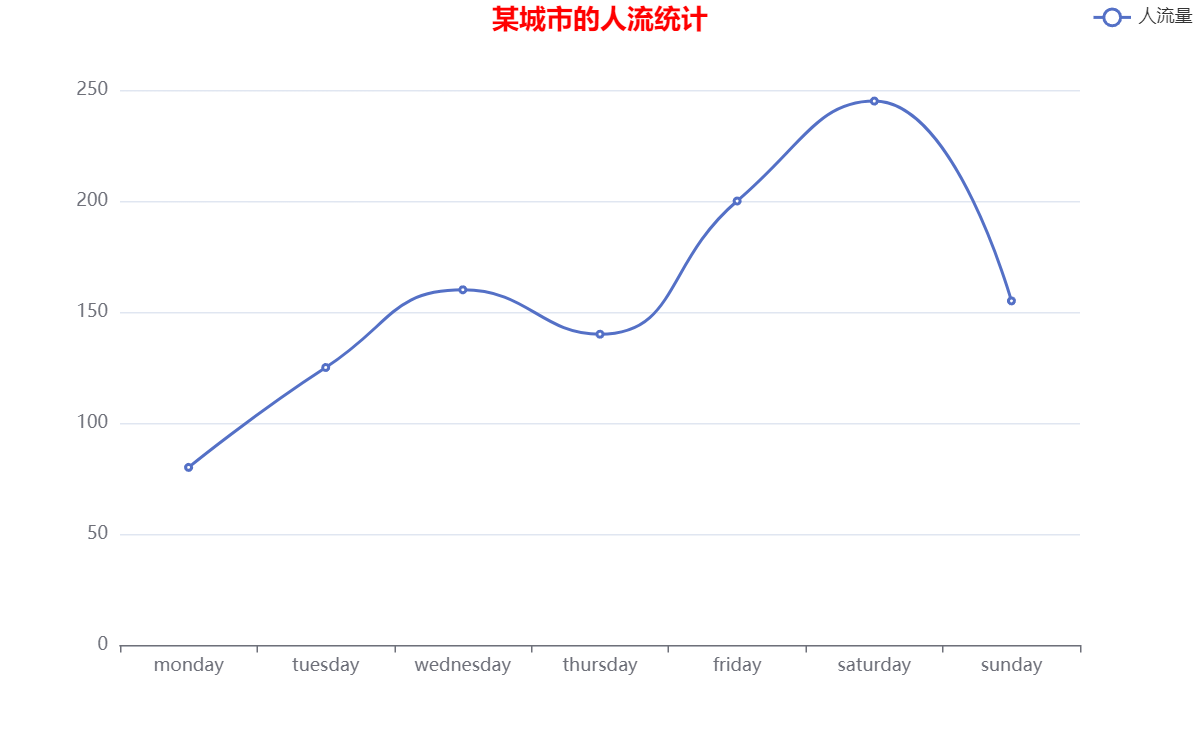
这是图片

1
2
3
4
5
6
7
8
9
10
11
12
13
14
15
16
17
18
19
20
21
22
23
24
25
26
27
28
29
30
31
32
33
34
35
36
37
38
39
40
41
42
43
44
45
46
47
48
49
50
51
52
53
54
55
56
57
58
59
60
61
62
63
64
65
66
67
68

<!DOCTYPE html>
<html lang="en">
<head>
<meta charset="UTF-8">
<meta name="viewport" content="width=device-width, initial-scale=1.0">
<title>Document</title>
<script src="echarts.js"></script>
<style>
.line{
width: 800px;
height: 500px;
background-color: aqua;
}
</style>
</head>
<body>
<div class="line"></div>
<script>
let box = document.querySelector('.line')
let myChart = echarts.init(box)
let option = {
title:{
text:'某城市的人流统计',
textStyle:{
color:'red'
},
x:'center'
},
legend:{
data:["人流量"],
left:'right'
}
,
tooltip:{
trigger:'axis',
// formatter:function(params){
// let tar = params[0];
// return tar.name+":<br/>"+tar.seriesName+":"+tar.value
// }

},
toolbox:{
show:true,
feature:{
mark:{show:true},
saveAsImage:{show:true}
},
top:14
},
xAxis:[{
type:'category',
data:["monday","tuesday","wednesday","thursday","friday","saturday","sunday"]
}],
yAxis:[{
type:'value'
}],
series:[{
name:'人流量',
type:'line',
data:[80,125,160,140,200,245,155],
smooth:true
}]
}
myChart.setOption(option)
</script>
</body>
</html>

堆积折线图:

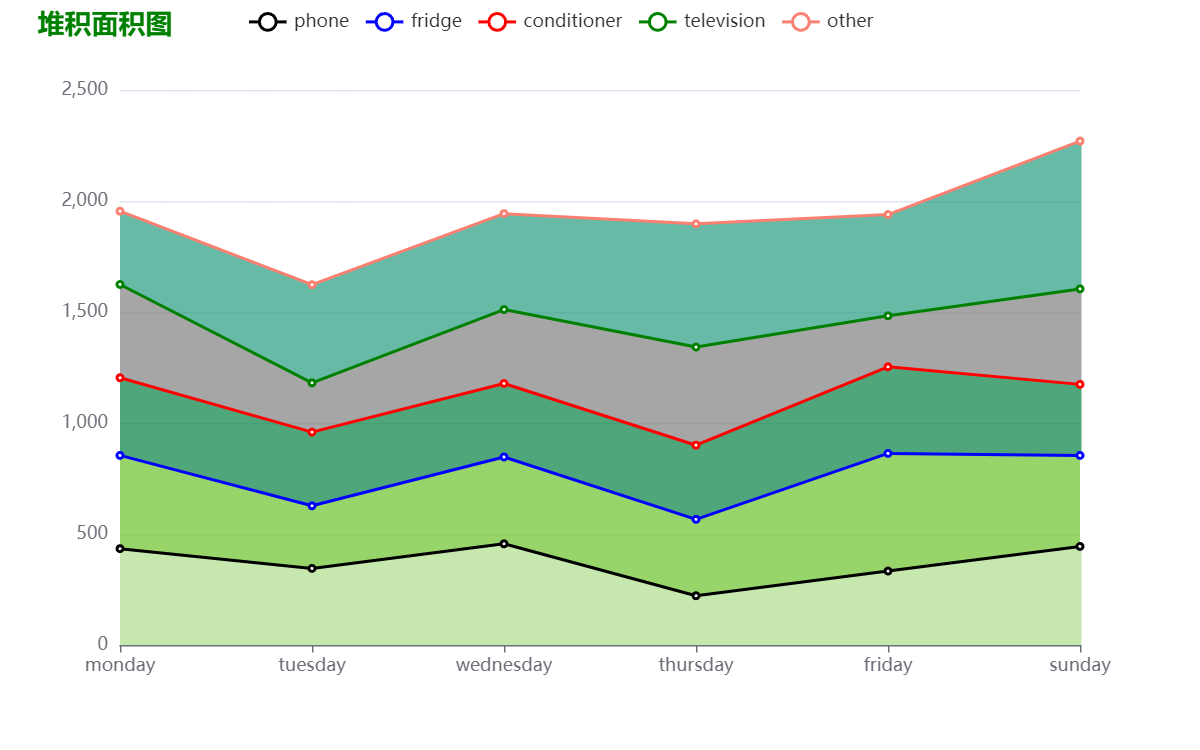
这是图片

1
2
3
4
5
6
7
8
9
10
11
12
13
14
15
16
17
18
19
20
21
22
23
24
25
26
27
28
29
30
31
32
33
34
35
36
37
38
39
40
41
42
43
44
45
46
47
48
49
50
51
52
53
54
55
56
57
58
59
60
61
62
63
64
65
66
67
68
69
70
71
72
73
74
75
76
77
78
79
80
81
82
83
84
85
86
87
88
89
90
91
92
93
94
95
96
97
98
99
100
101
102
103
104
105
106
107
108
109
110
111
112
113
114
115
116
117
118
119
120
121
122
123
124
125
126
127
128
129
130
131
<!DOCTYPE html>
<html lang="en">
<head>
<meta charset="UTF-8">
<meta name="viewport" content="width=device-width, initial-scale=1.0">
<title>Document</title>
<script src="echarts.js"></script>
<style>
.line{
width: 800px;
height: 500px;
background-color: aqua;
}
</style>
</head>
<body>
<div class="line"></div>
<script>
let box = document.querySelector(".line")
let myChart = echarts.init(box)
let option = {
title:{
text:"堆积面积图",
textStyle:{
color:'green'
},
left:20,
top:3
},
legend:{
data:['phone','fridge','conditioner','television','other'],
left:160,
top:3
},
tooltip:{
trigger:'axis'
},
toolbox:{
show:true,
orient:"vertical",
feature:{
dataView:{show:true,readOnly:false},
mark:{show:true},
magicType:{show:true,type:['line','bar','stack','tiled']},
restore:{show:true},
saveAsImage:{show:true}
},
top:"center"
},
calculable:true,
xAxis:[{
type:'category',
boundaryGap:false,
data:['monday','tuesday','wednesday','thursday','friday','sunday']
}],
yAxis:[{
type:'value'
}],
series:[
{
name:'phone',
type:'line',
stack:'总量',
color:'rgb(0,0,0)',
itemStyle:{
normal:{
areaStyle:{type:'default',color:'rgb(174,221,139)'}
}
},
data:[434,345,456,222,333,444,432]
},
{
name:'fridge',
type:'line',
stack:'总量',
color:'blue',
itemStyle:{
normal:{
areaStyle:{type:'default',color:'rgb(107,194,43)'}
}
},
data:[420,282,391,344,530,410]
},
{
name:'conditioner',
type:'line',
stack:'总量',
color:"red",
itemStyle:{
normal:{
areaStyle:{type:'default',color:'rgb(6,128,67)'}
}
},
data:[350,332,331,334,390,320,340]
},
{
name:'television',
type:'line',
stack:'总量',
color:'green',
itemStyle:{
normal:{
areaStyle:{
type:'default',
color:"grey"
}
}
},
data:[420,222,333,442,230,430,430]
},
{
name:'other',
type:'line',
stack:'总量',
color:'#FA8072',
itemStyle:{
normal:{
areaStyle:{
type:'default',
color:'rgb(38,157,128)'
}
}
},
data:[330,442,432,555,456,666,877]
}
]
}
myChart.setOption(option)
</script>
</body>
</html>

阶梯图:

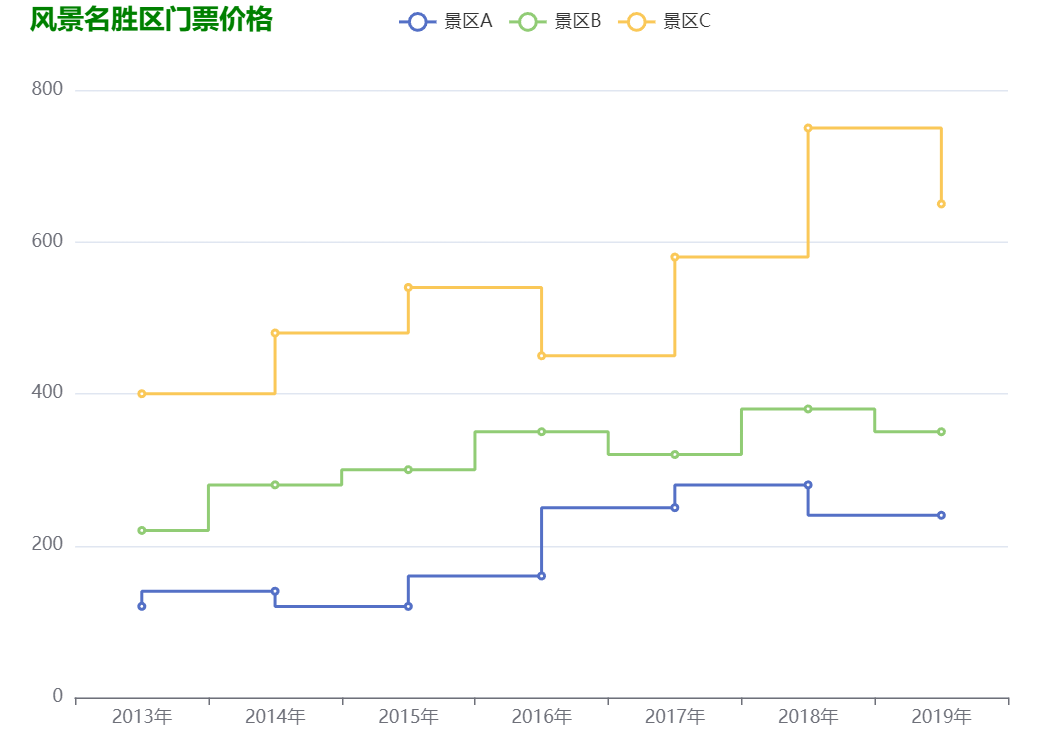
这是图片

1
2
3
4
5
6
7
8
9
10
11
12
13
14
15
16
17
18
19
20
21
22
23
24
25
26
27
28
29
30
31
32
33
34
35
36
37
38
39
40
41
42
43
44
45
46
47
48
49
50
51
52
53
54
55
56
57
58
59
60
61
62
63
64
65
66
67
68
69
70
71
72
73
74
75
76
77
78
79
80
81
<!DOCTYPE html>
<html lang="en">
<head>
<meta charset="UTF-8">
<meta name="viewport" content="width=device-width, initial-scale=1.0">
<title>Document</title>

<script src="echarts.js"></script>
<style>
.line{
width: 700px;
height: 500px;
background-color: aqua;
}
</style>
</head>
<body>
<div class="line"></div>
<script>
let box = document.querySelector('.line')
let myChart = echarts.init(box)
let option = {
title:{
text:'风景名胜区门票价格',
textStyle:{
color:'green'
},
left:15,
top:0
},
legend:{
data:['景区A','景区B','景区C'],
left:260,
top:3
},
tooltip:{
trigger:"axis"
},
grid:{
left:'3%',
right:'4%',
bottom:'3%',
containLabel:true
},
toolbox:{
show:true,
feature:{
saveAsImage:{show:true}
}
},
xAxis:{
type:'category',
data:["2013年",'2014年','2015年','2016年','2017年','2018年','2019年']
},
yAxis:{
type:'value'
},
series:[{
name:'景区A',
type:'line',
step:'start',
data:[120,140,120,160,250,280,240]
},
{
name:'景区B',
type:'line',
step:'middle',
data:[220,280,300,350,320,380,350]
},
{
name:'景区C',
type:'line',
step:'end',
data:[400,480,540,450,580,750,650]
}
]
}
myChart.setOption(option)
</script>
</body>
</html>

拼图(pie)

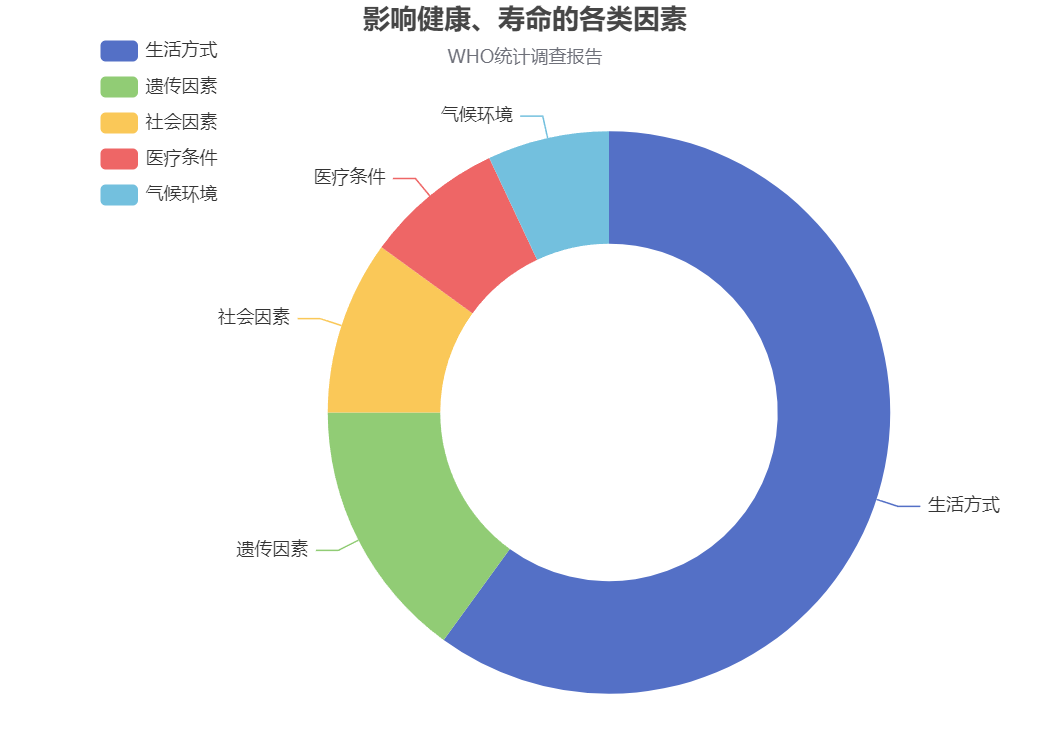
简单饼图:

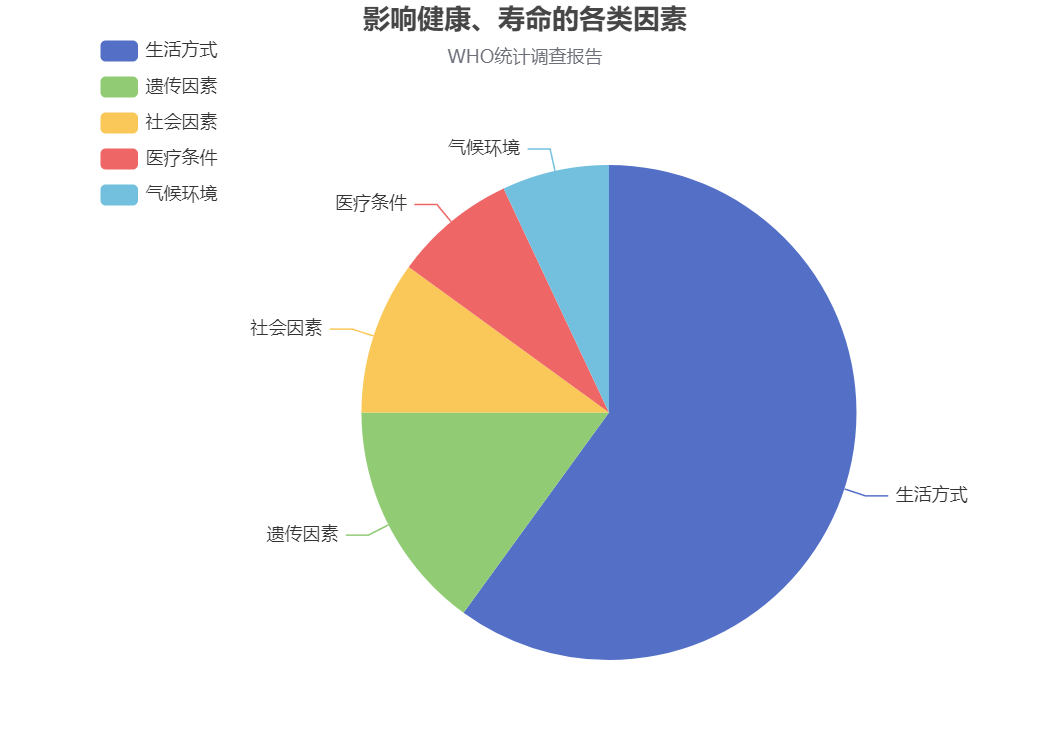
这是图片

1
2
3
4
5
6
7
8
9
10
11
12
13
14
15
16
17
18
19
20
21
22
23
24
25
26
27
28
29
30
31
32
33
34
35
36
37
38
39
40
41
42
43
44
45
46
47
48
49
50
51
52
53
54
55
56
57
58
59
60
61
62
63
64
65
66
67
68
69
70
71
72
73
74
75
76
77
78
79
80
81
82
83
84
85
86
87
88
89
90
91
92
<!DOCTYPE html>
<html lang="en">

<head>
<meta charset="UTF-8">
<meta name="viewport" content="width=device-width, initial-scale=1.0">
<title>Document</title>
<script src="echarts.js"></script>
<style>
.pid {
width: 700px;
height: 500px;
background-color: aqua;
}
</style>
</head>

<body>
<div class="pid"></div>
<script>
let box = document.querySelector(".pid")
let myChart = echarts.init(box)
let option = {
title: {
text: "影响健康、寿命的各类因素",
subtext: "WHO统计调查报告",
left: "center"
},
toolbox: {
show: true,
left: 444,
top: 28,
feature: {
mark: {
show: true
},
dataView: {
show: true, readOnly: false
},
magicType: {
show: true,
type: ["pid", "funnel"],
option: {
funnel: {
x: '25%',
width: '50%',
funnelAlign: 'left',
max: 1548
}
}
},
restore: {
show: true
},
saveAsImage: { show: true }
}
},
tooltip: {
trigger: 'item',
formatter: "{a} <br/> {b} : {c} ({d}%)"
},
legend: {
data: ['生活方式', '遗传因素', '社会因素', '医疗条件', '气候环境'],
left: 62,
orient: 'vertical',
top: 22
},
calculable: true,
series: [
{
name: '访问来源',
type: 'pie',
// radius:["45%","75%"],
radius: '66%',
center: ['58%', '55%'],
//沿着顺时针旋转
clockWise: true,
data: [
{ value: 60, name: '生活方式' },
{ value: 15, name: '遗传因素' },
{ value: 10, name: '社会因素' },
{ value: 8, name: '医疗条件' },
{ value: 7, name: '气候环境' },
]
}
]
}
myChart.setOption(option)
</script>
</body>

</html>

环形图:

这是图片

1
2
3
4
5
6
7
8
9
10
11
12
13
14
15
16
17
18
19
20
21
22
23
24
25
26
27
28
29
30
31
32
33
34
35
36
37
38
39
40
41
42
43
44
45
46
47
48
49
50
51
52
53
54
55
56
57
58
59
60
61
62
63
64
65
66
67
68
69
70
71
72
73
74
75
76
77
78
79
80
81
82
83
84
85
86
87
88
89
90
91
92
<!DOCTYPE html>
<html lang="en">

<head>
<meta charset="UTF-8">
<meta name="viewport" content="width=device-width, initial-scale=1.0">
<title>Document</title>
<script src="echarts.js"></script>
<style>
.pid {
width: 700px;
height: 500px;
background-color: aqua;
}
</style>
</head>

<body>
<div class="pid"></div>
<script>
let box = document.querySelector(".pid")
let myChart = echarts.init(box)
let option = {
title: {
text: "影响健康、寿命的各类因素",
subtext: "WHO统计调查报告",
left: "center"
},
toolbox: {
show: true,
left: 444,
top: 28,
feature: {
mark: {
show: true
},
dataView: {
show: true, readOnly: false
},
magicType: {
show: true,
type: ["pid", "funnel"],
option: {
funnel: {
x: '25%',
width: '50%',
funnelAlign: 'left',
max: 1548
}
}
},
restore: {
show: true
},
saveAsImage: { show: true }
}
},
tooltip: {
trigger: 'item',
formatter: "{a} <br/> {b} : {c} ({d}%)"
},
legend: {
data: ['生活方式', '遗传因素', '社会因素', '医疗条件', '气候环境'],
left: 62,
orient: 'vertical',
top: 22
},
calculable: true,
series: [
{
name: '访问来源',
type: 'pie',
radius:["45%","75%"],
// radius: '66%',
center: ['58%', '55%'],
//沿着顺时针旋转
clockWise: true,
data: [
{ value: 60, name: '生活方式' },
{ value: 15, name: '遗传因素' },
{ value: 10, name: '社会因素' },
{ value: 8, name: '医疗条件' },
{ value: 7, name: '气候环境' },
]
}
]
}
myChart.setOption(option)
</script>
</body>

</html>

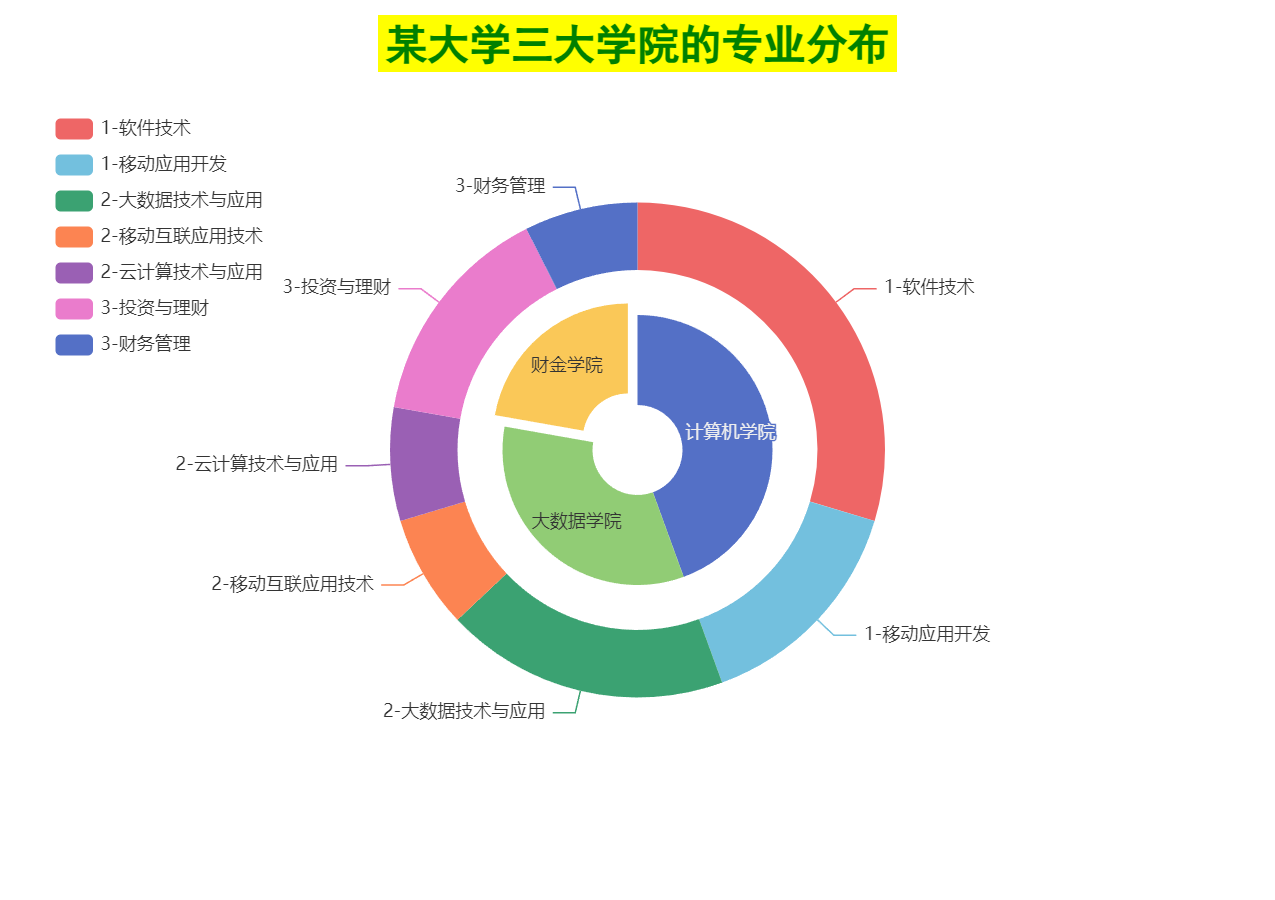
堆积拼图:

这是图片

1
2
3
4
5
6
7
8
9
10
11
12
13
14
15
16
17
18
19
20
21
22
23
24
25
26
27
28
29
30
31
32
33
34
35
36
37
38
39
40
41
42
43
44
45
46
47
48
49
50
51
52
53
54
55
56
57
58
59
60
61
62
63
64
65
66
67
68
69
70
71
72
73
74
75
76
77
78
79
80
81
82
83
84
85
86
87
88
89
90
91
92
93
<!DOCTYPE html>
<html lang="en">
<head>
<meta charset="UTF-8">
<meta name="viewport" content="width=device-width, initial-scale=1.0">
<title>Document</title>
<script src="echarts.js"></script>
<style>
.pie{
width: 850px;
height: 600px;
background-color: aqua;
}
</style>
</head>
<body>
<div class="pie"></div>
<script>
let box = document.querySelector('.pie')
let myChart = echarts.init(box)
let option = {
title:{
text:"某大学三大学院的专业分布",
backgroundColor:"yellow",
textStyle:{
color:'green',
fontSize:28,
fontFamily:"黑体"
},
top:10,
x:"center"
},
tooltip:{
trigger:"item",
formatter:'{a}<br/>{b}:{c}({d}%)'
},
legend:{
orient:"vertical",
x:32,
y:74,
data:['1-软件技术','1-移动应用开发','2-大数据技术与应用','2-移动互联应用技术','2-云计算技术与应用','3-投资与理财','3-财务管理']
},
toolbox:{
show:true,
x:700,
feature:{
mark:{show:true},
dataView:{show:true,readOnly:false},
magicType:{type:["pie","funnel"],show:true},
restore:{show:true},
saveAsImage:{show:true}
}
},
calculable:false,
series:[
{
name:'专业名称',
type:'pie',
selectedMode:'single',
radius:['10%','30%'],
label:{
position:'inner'
},
labelLine:{
show: false
},
data:[
{value:1200,name:'计算机学院'},
{value:900,name:'大数据学院'},
{value:600,name:'财金学院',selected:true},
]
},
{
name:'专业名称',
type:'pie',
selectedMode:'single',
radius:['40%','55%'],
data:[
{value:800,name:'1-软件技术'},
{value:400,name:'1-移动应用开发'},
{value:500,name:'2-大数据技术与应用'},
{value:200,name:'2-移动互联应用技术'},
{value:200,name:'2-云计算技术与应用'},
{value:400,name:'3-投资与理财'},
{value:200,name:'3-财务管理'},
]
}
]
}
myChart.setOption(option)
</script>
</body>
</html>

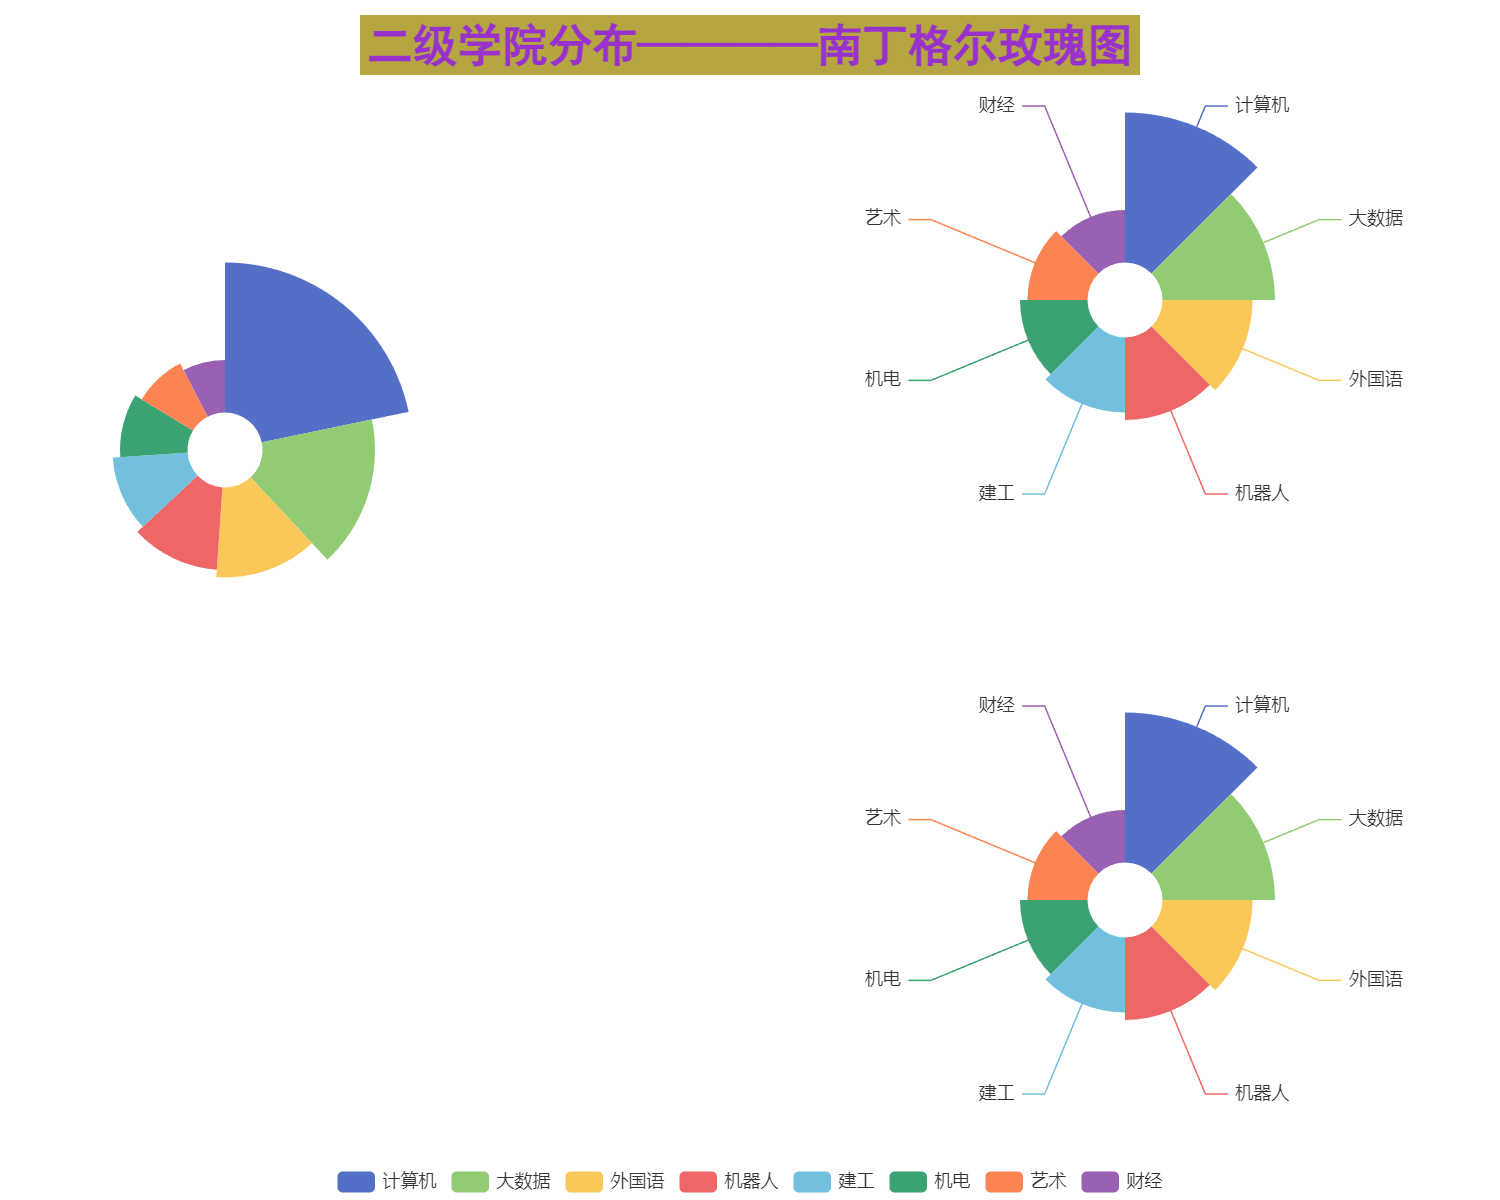
玫瑰拼图:

这是图片

1
2
3
4
5
6
7
8
9
10
11
12
13
14
15
16
17
18
19
20
21
22
23
24
25
26
27
28
29
30
31
32
33
34
35
36
37
38
39
40
41
42
43
44
45
46
47
48
49
50
51
52
53
54
55
56
57
58
59
60
61
62
63
64
65
66
67
68
69
70
71
72
73
74
75
76
77
78
79
80
81
82
83
84
85
86
87
88
89
90
91
92
93
94
95
96
97
98
99
100
101
102
103
104
105
106
107
108
109
110
111
112
113
114
115
116
117
118
119
120
121
122
123
124
125
126
127
128
129
130
131
132
133
134
135
136
137
138
139
140
141
142
143
144
145
<!DOCTYPE html>
<html lang="en">
<head>
<meta charset="UTF-8">
<meta name="viewport" content="width=device-width, initial-scale=1.0">
<title>Document</title>
<script src="echarts.js"></script>
<style>
.rose{
width: 1000px;
height: 800px;
background-color: aqua;
}
</style>
</head>
<body>
<div class = 'rose'></div>
<script>
let box = document.querySelector(".rose")
let myChart = echarts.init(box)
let option = {
title:{
text:"二级学院分布————南丁格尔玫瑰图",
backgroundColor:"#B5A642",
x:'center',
y:10,
textStyle:{
fontSize:30,
fontFamily:"黑体",
color:"#9932CD"
},
},
tooltip:{
trigger:"item",
formatter:"{a}<br/>{b}:{c}({d}%)"
},
legend:{
data:['计算机','大数据','外国语','机器人','建工','机电','艺术','财经'],
x:"center",
y:"bottom"
},
toolbox:{
show:true,
x:800,
y:10,

feature:{
mark:{show:true},
dataView:{show:true,readOnly:false},
magicType:{
show:true,
type:['pie','funnel']
},
restore:{show:true},
saveAsImage:{show:true}
}
},
calculable:true,
series:[
{
name:'学生人数(半径模式)',
type:'pie',
radius:['10%',"50%"],
center:['30%',300],
roseType:'radius',//设置南丁格尔玫瑰图参数:半径模式
width:'50%',
max:40,
itemStyle:{
normal:{
label:{
show:false
},
labelLine:{
show:false
}
}
},
emphasis:{
label:{
show:true,
},
labelLine:{
show:true
}
},
data:[
{value:2000,name:'计算机'},
{value:1500,name:'大数据'},
{value:1200,name:'外国语'},
{value:1100,name:'机器人'},
{value:1000,name:'建工'},
{value:900,name:'机电'},
{value:800,name:'艺术'},
{value:700,name:'财经'},
]
},
{
name:'学生人数(面积模式)',
type:'pie',
radius:["10%","50%"],
center:["50%",200],
roseType:'area',//设置南丁格尔玫瑰图为面积模式
x:"50%",
max:40,
sort:'ascending',
data:[
{value:2000,name:'计算机'},
{value:1500,name:'大数据'},
{value:1200,name:'外国语'},
{value:1100,name:'机器人'},
{value:1000,name:'建工'},
{value:900,name:'机电'},
{value:800,name:'艺术'},
{value:700,name:'财经'},
]
},
{
name:'教授人数(面积模式)',
type:'pie',
radius:["10%","50%"],
center:["50%",600],
roseType:'area',
x:"50%",
max:40,
sorrt:'ascending',
data:[
{value:2000,name:'计算机'},
{value:1500,name:'大数据'},
{value:1200,name:'外国语'},
{value:1100,name:'机器人'},
{value:1000,name:'建工'},
{value:900,name:'机电'},
{value:800,name:'艺术'},
{value:700,name:'财经'},
]
}

]
}
myChart.setOption(option)
</script>


</body>
</html>