1
2
3
4
5
6
7
8
9
10
11
12
13
14
15
16
17
18
19
20
21
22
23
24
25
26
27
28
29
30
31
32
33
34
35
36
37
38
39
40
41
42
43
44
45
46
47
48
49
50
51
52
53
54
55
56
57
58
59
60
61
62
63
64
65
66
67
68
69
70
71
72
73
| <!DOCTYPE html>
<html lang="en">
<head>
<meta charset="UTF-8">
<meta name="viewport" content="width=device-width, initial-scale=1.0">
<title>Document</title>
<script src="echarts.js"></script>
<style>
.box{
width: 1500px;
height: 600px;
}
</style>
</head>
<body>
<div class = "box"></div>
<script>
let box = document.querySelector(".box")
let myCharts = echarts.init(box)
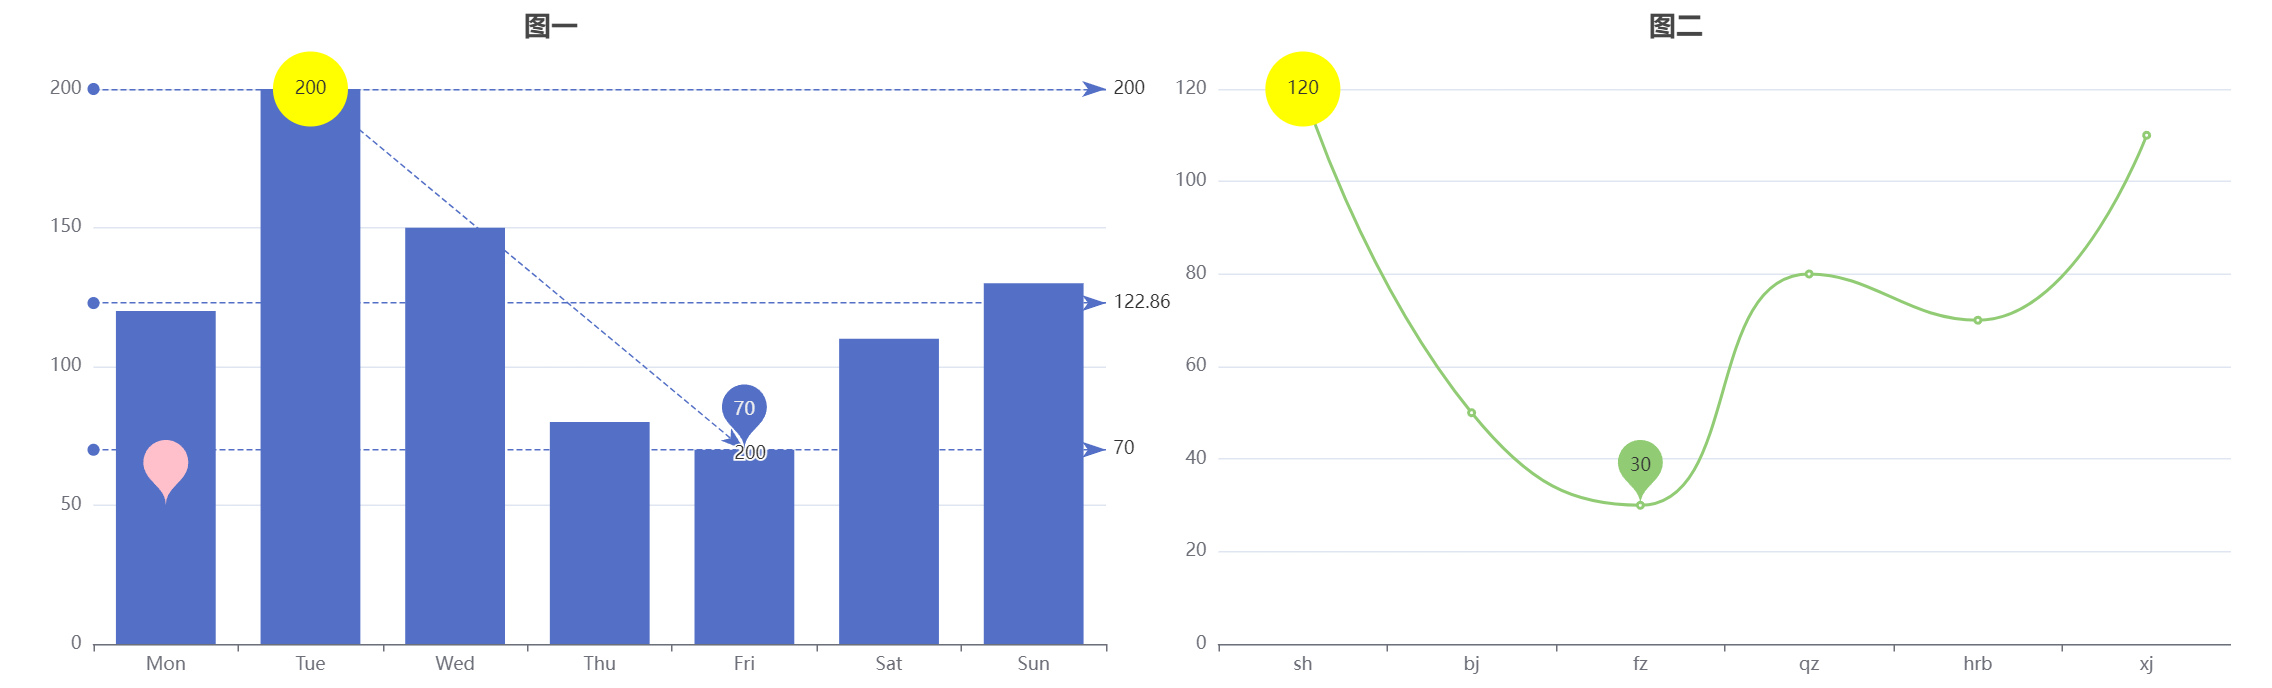
let option ={
title:[
{text:"图一",left:"25%",top:"1%"},
{text:"图二",left:"75%",top:"1%"}
],
grid:[
{
left:"5%",
width:"45%"
},{
left:"55%",
width:"45%"
}
],
yAxis:[
{
type:"value"
},
{
gridIndex:1,
min:0,
max:120,
type:"value"
}
],
xAxis:[
{
type:"category",
data:["Mon","Tue","Web","Thu","Fri","Sat","Sun"]
},
{
gridIndex:1,
type:"category",
data:["january","february","march"]
}
],
series:[
{
type:'bar',
data:[120, 200, 150, 80, 70, 110, 130],
},
{
smooth:true,
type:'line',
data:[44, 20, 100, 80, 70, 40, 80],
yAxisIndex:1,
xAxisIndex:1
}
]
}
myCharts.setOption(option)
</script>
</body>
</html>
|