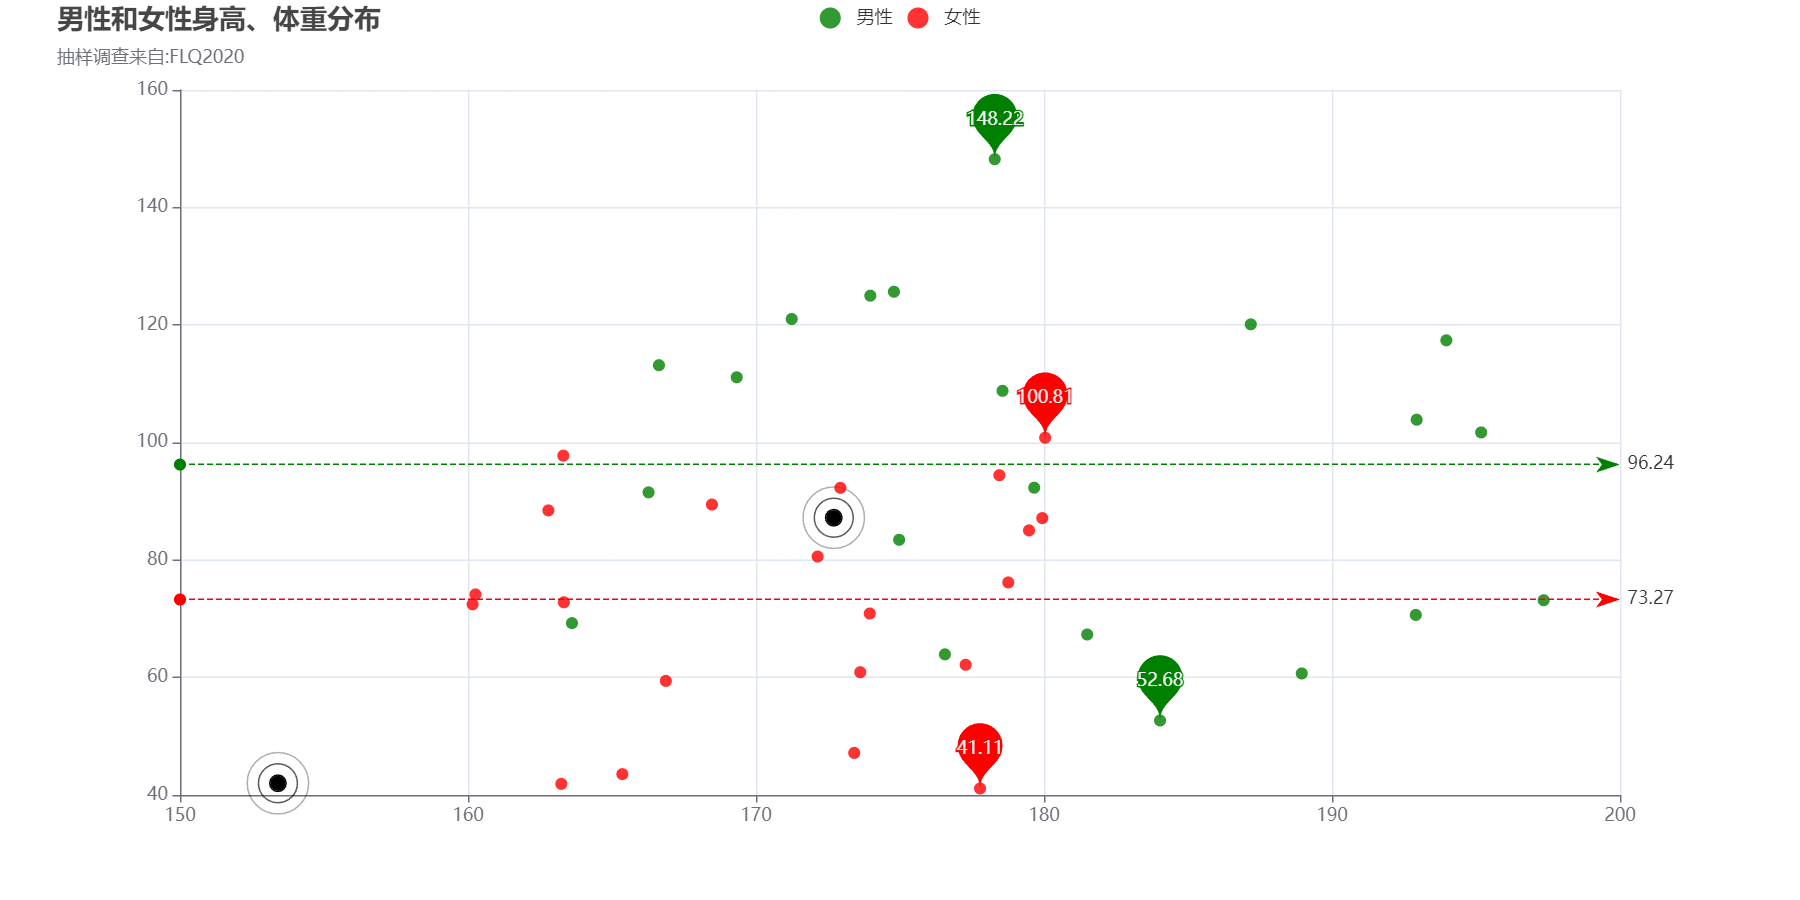
散点图

这是图片

1
2
3
4
5
6
7
8
9
10
11
12
13
14
15
16
17
18
19
20
21
22
23
24
25
26
27
28
29
30
31
32
33
34
35
36
37
38
39
40
41
42
43
44
45
46
47
48
49
50
51
52
53
54
55
56
57
58
59
60
61
62
63
64
65
66
67
68
69
70
71
72
73
74
75
76
77
78
79
80
81
82
83
84
85
86
87
88
89
90
91
92
93
94
95
96
97
98
99
100
101
102
103
104
105
106
107
108
109
110
111
112
113
114
115
116
117
118
119
120
121
122
123
124
125
126
127
128
129
130
131
132
133
134
135
136
137
138
139
140
<!DOCTYPE html>
<html lang="en">
<head>
<meta charset="UTF-8">
<meta name="viewport" content="width=device-width, initial-scale=1.0">
<title>Document</title>
</head>
<script src="echarts.js"></script>
<style>
.box{
width:1200px;
height: 600px;
}
</style>
<body>
<div class="box"></div>
<script>
let dataWomen = []
for (let i =0;i<21;i++){
data = [Math.floor((Math.random()*(180-160+1)+160)*100)/100,Math.floor((Math.random()*(100-40+1)+40)*100)/100]
dataWomen.push(data)
}
let dataMen = []
for (let i =0;i<21;i++){
data = [Math.floor((Math.random()*(200-160+1)+160)*100)/100,Math.floor((Math.random()*(150-50+1)+50)*100)/100]
dataMen.push(data)
}
console.log(dataWomen)
let box = document.querySelector(".box")
let myChart = echarts.init(box)
let option = {
color:["red","green"],
title:{
x:33,
text:"男性和女性身高、体重分布",
subtext:"抽样调查来自:FLQ2020"
},
legend:{
data:["男性","女性"]
},
toolbox:{
x:900,show:true,
feature:{
dataZoom:{
show:true
},
dataView:{
show:true
},
restore:{
show:true
},
saveAsImage:{
show:true
}
}
},
xAxis:[{
type:'value',
scale:true,
axisLable:{
formatter:"{value}cm"
}
}],
yAxis:[{
type:"value",
scale:true,
axisLable:{
formatter:"{value}kg"
}
}],
series:[
{
type:'effectScatter',
name:'极值',
rippleEffect:{
period:2,
scale:5.5,
brushType:'stroke'
},
color:'black',
data:[
[172.7,87.2],
[153.4,42]
]
},
{
name:'女性',
symbolSize:8,
type:"scatter",
data:dataWomen,
markPoint:{
data:[
{
type:'max',
name:'最大值'
},
{
type:'min',
name:"最小值"
}
]
},
markLine:{
data:[
{type:"average",name:'平均值'}
]
}
},
{
name:'男性',
symbolSize:8,
type:"scatter",
data:dataMen,
markPoint:{
data:[
{
type:'max',
name:'最大值'
},
{
type:'min',
name:"最小值"
}
]
},
markLine:{
data:[
{type:"average",name:'平均值'}
]
}

},

]
}
myChart.setOption(option)
</script>
</body>
</html>

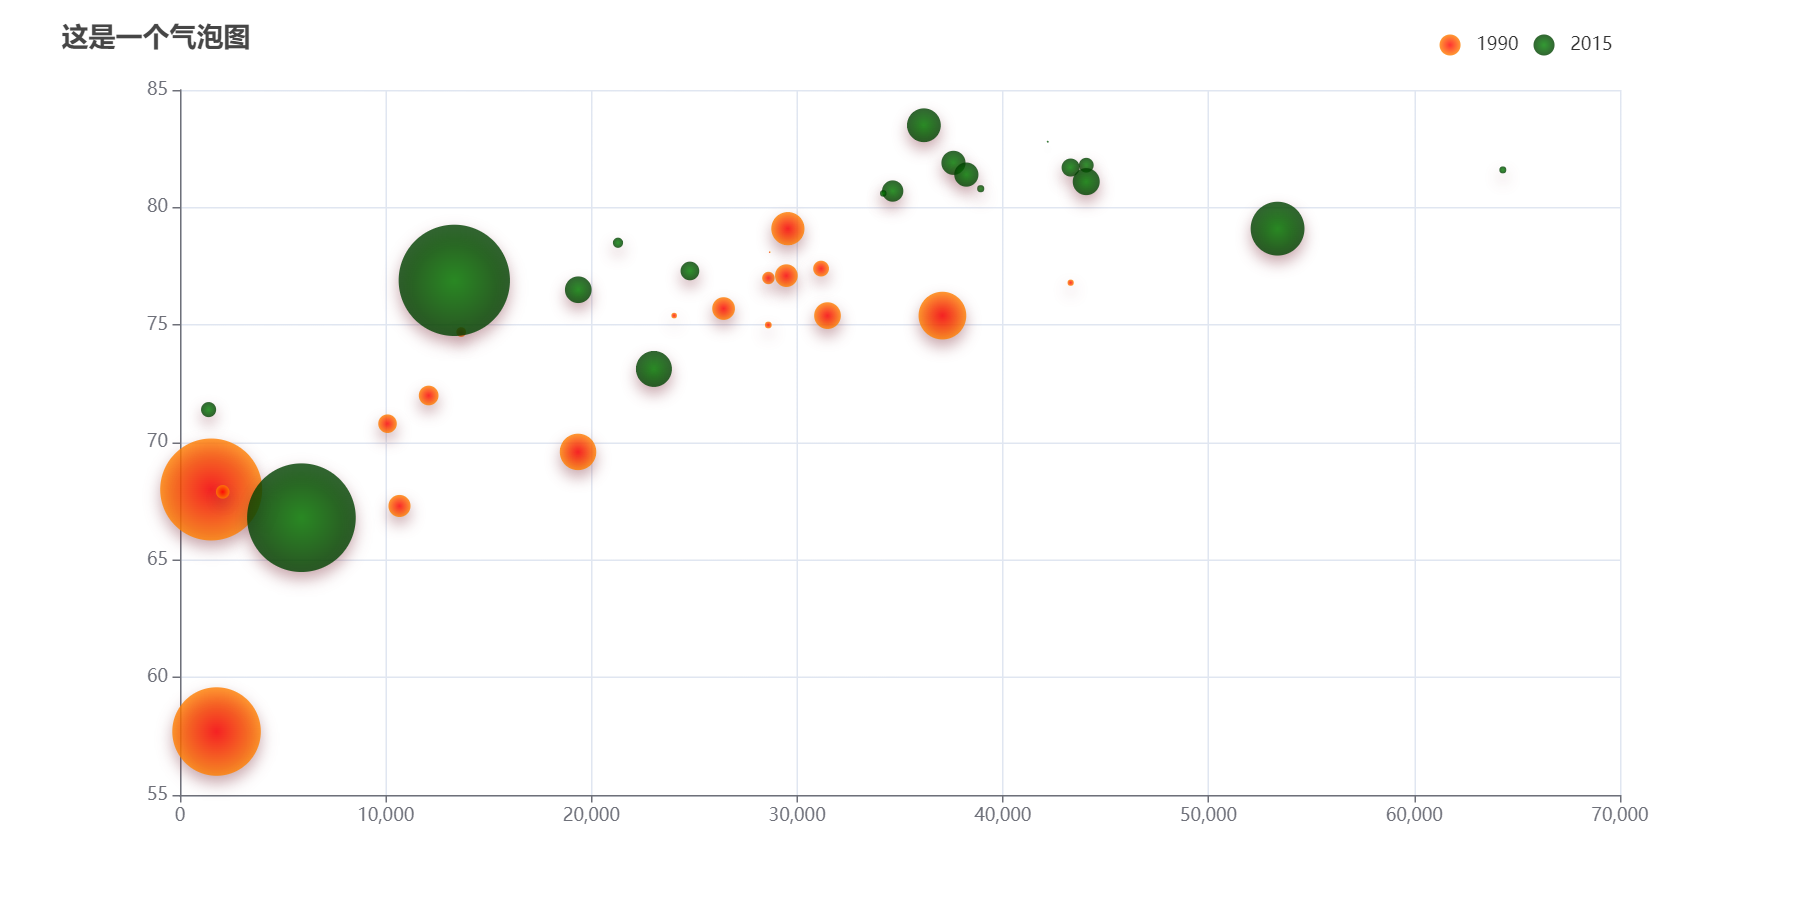
气泡图

这是图片

1
2
3
4
5
6
7
8
9
10
11
12
13
14
15
16
17
18
19
20
21
22
23
24
25
26
27
28
29
30
31
32
33
34
35
36
37
38
39
40
41
42
43
44
45
46
47
48
49
50
51
52
53
54
55
56
57
58
59
60
61
62
63
64
65
66
67
68
69
70
71
72
73
74
75
76
77
78
79
80
81
82
83
84
85
86
87
88
89
90
91
92
93
94
95
96
97
98
99
100
101
102
103
104
105
106
107
108
109
110
111
112
113
114
115
116
117
118
119
120
121
122
123
124
125
126
127
128
129
130
131
132
133
134
135
136
137
138
139
140
141
142
143
144
145
146
147
148
149
150
151
152
153
154
155
156
157
158
159
160
161
<!DOCTYPE html>
<html lang="en">
<head>
<meta charset="UTF-8">
<meta name="viewport" content="width=device-width, initial-scale=1.0">
<title>Document</title>
<script src="echarts.js"></script>
<style>
.box{
height: 600px;
width: 1200px;
}
</style>
</head>
<body>
<div class="box"></div>
<script>
let box = document.querySelector(".box")
let myChart = echarts.init(box)
const data = [
[
[28604, 77, 17096869, 'Australia', 1990],
[31163, 77.4, 27662440, 'Canada', 1990],
[1516, 68, 1154605773, 'China', 1990],
[13670, 74.7, 10582082, 'Cuba', 1990],
[28599, 75, 4986705, 'Finland', 1990],
[29476, 77.1, 56943299, 'France', 1990],
[31476, 75.4, 78958237, 'Germany', 1990],
[28666, 78.1, 254830, 'Iceland', 1990],
[1777, 57.7, 870601776, 'India', 1990],
[29550, 79.1, 122249285, 'Japan', 1990],
[2076, 67.9, 20194354, 'North Korea', 1990],
[12087, 72, 42972254, 'South Korea', 1990],
[24021, 75.4, 3397534, 'New Zealand', 1990],
[43296, 76.8, 4240375, 'Norway', 1990],
[10088, 70.8, 38195258, 'Poland', 1990],
[19349, 69.6, 147568552, 'Russia', 1990],
[10670, 67.3, 53994605, 'Turkey', 1990],
[26424, 75.7, 57110117, 'United Kingdom', 1990],
[37062, 75.4, 252847810, 'United States', 1990]
],
[
[44056, 81.8, 23968973, 'Australia', 2015],
[43294, 81.7, 35939927, 'Canada', 2015],
[13334, 76.9, 1376048943, 'China', 2015],
[21291, 78.5, 11389562, 'Cuba', 2015],
[38923, 80.8, 5503457, 'Finland', 2015],
[37599, 81.9, 64395345, 'France', 2015],
[44053, 81.1, 80688545, 'Germany', 2015],
[42182, 82.8, 329425, 'Iceland', 2015],
[5903, 66.8, 1311050527, 'India', 2015],
[36162, 83.5, 126573481, 'Japan', 2015],
[1390, 71.4, 25155317, 'North Korea', 2015],
[34644, 80.7, 50293439, 'South Korea', 2015],
[34186, 80.6, 4528526, 'New Zealand', 2015],
[64304, 81.6, 5210967, 'Norway', 2015],
[24787, 77.3, 38611794, 'Poland', 2015],
[23038, 73.13, 143456918, 'Russia', 2015],
[19360, 76.5, 78665830, 'Turkey', 2015],
[38225, 81.4, 64715810, 'United Kingdom', 2015],
[53354, 79.1, 321773631, 'United States', 2015]
]
];
let option = {
title:{
text:"这是一个气泡图",
left:'3%',
top:"2%"
},
toolbox:{
show:true,
feature:{
saveAsImage:{
show:true
}
}
},
xAxis:{
scale:true
},
yAxis:{
scale:true
},
legend: {
right: '10%',
top: '3%',
data: ['1990', '2015']
},
series:[
{
name:'1990',
type:"scatter",
data:data[0],
symbolSize:function(data){
return Math.sqrt(data[2])/5e2
},
emphasis:{
focus:"series",
label:{
show:true,
formatter:function(p){
return p.data[3]
}
}
},
itemStyle:{
shadowBlur: 10,
shadowColor: 'rgba(120, 36, 50, 0.5)',
shadowOffsetY: 5,
color: new echarts.graphic.RadialGradient(0.5,0.5,1,[
{
offset:0,
color:'red'
},
{
offset:1,
color:'yellow'
}
])
}
},
{

data:data[1],
name:'2015',
type:'scatter',
symbolSize:function(data){
return Math.sqrt(data[2]) /5e2
},
emphasis:{
focus:'series',
label:{
show:true,
formatter:function(p){
p.data[3]
}
}
},
itemStyle:{
shadowBlur: 10,
shadowColor: 'rgba(120, 36, 50, 0.5)',
shadowOffsetY: 5,
color:new echarts.graphic.RadialGradient(0.5,0.5,1,[
{
offset:0,
color:'green'
},
{
offset:1,
color:'black'
}
])
}

}
]
}
myChart.setOption(option)
</script>
</body>
</html>

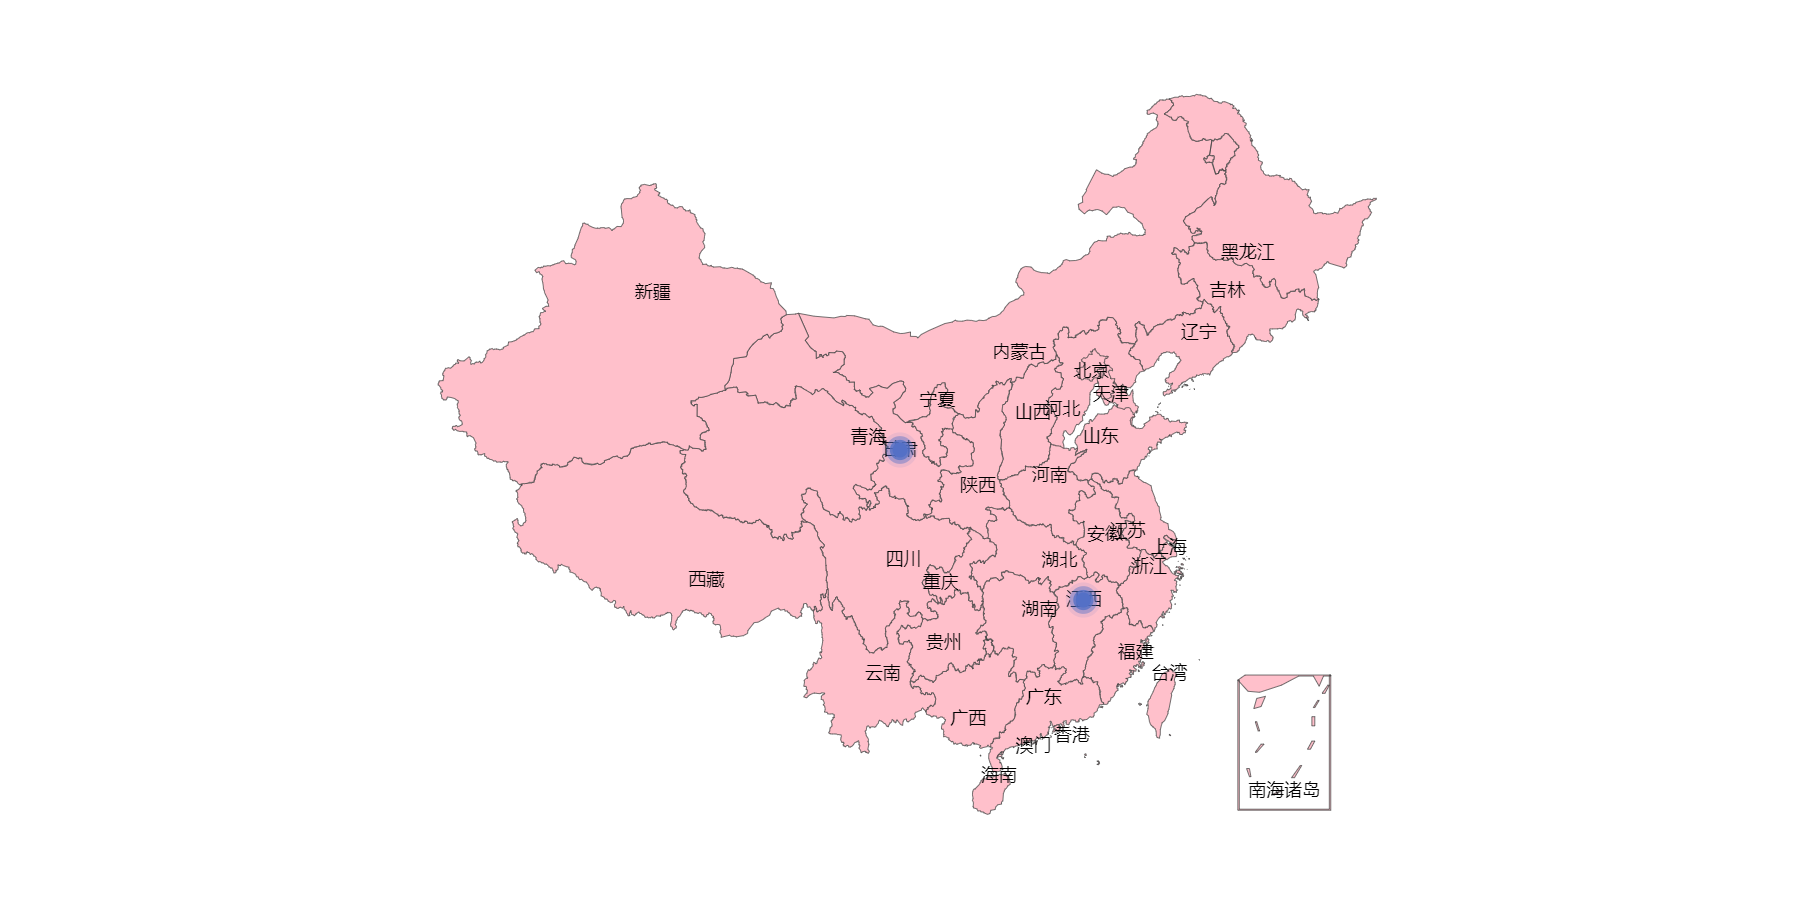
地图

这是图片

1
2
3
4
5
6
7
8
9
10
11
12
13
14
15
16
17
18
19
20
21
22
23
24
25
26
27
28
29
30
31
32
33
34
35
36
37
38
39
40
41
42
43
44
45
46
47
48
49
50
51
52
53
54
55
56
57
58
59
<!DOCTYPE html>
<html lang="en">
<head>
<meta charset="UTF-8">
<meta name="viewport" content="width=device-width, initial-scale=1.0">
<title>Document</title>
<script src="echarts.js"></script>
<script src="jquery/jquery.js"></script>
<script src="map/map/json/china.json"></script>
<style>
.box{
height: 600px;
width: 1200px;
}
</style>
</head>
<body>
<div class="box"></div>
<script>
let box = document.querySelector(".box")
let myChart = echarts.init(box)
$.get("map/map/json/china.json",function(ret){
echarts.registerMap('china',ret)
let option={
toolbox:{
show:true,
feature:{
saveAsImage:{
show:true
}
}
},
geo:{
map:'china',
roam:true,
center:[103.84,36.07],
label:{
show:true
},
zoom:1,
itemStyle:{
areaColor:'pink'
}
},
series:[
{
type:'effectScatter',
data:[[103.84,36.07],[115.87,28.69]],
coordinateSystem:'geo'
}
]

}
myChart.setOption(option)
})
</script>

</body>
</html>

雷达图

这是图片

1
2
3
4
5
6
7
8
9
10
11
12
13
14
15
16
17
18
19
20
21
22
23
24
25
26
27
28
29
30
31
32
33
34
35
36
37
38
39
40
41
42
43
44
45
46
47
48
49
50
51
52
53
54
55
56
57
58
59
60
61
62
63
64
65
66
67
68
69
70
71
72
73
<!DOCTYPE html>
<html lang="en">
<head>
<meta charset="UTF-8">
<meta name="viewport" content="width=device-width, initial-scale=1.0">
<title>Document</title>
<script src="echarts.js"></script>
<style>
.box{
height: 600px;
width: 1200px;
}
</style>
</head>
<body>
<div class="box"></div>
<script>
let box = document.querySelector(".box")
let myChart = echarts.init(box)
let option ={
toolbox:{
show:true,
feature:{
saveAsImage:{
show:true
}
}
},
radar:[
{
indicator:[
{
name:'高中',max:9000000
},
{
name:'专科',max:5000000
},
{
name:'本科',max:3500000
},
{
name:'硕士',max:800000
},
{
name:'博士',max:20000
},
]
}
],
series:[

{
type:'radar',
data:[
{
name:'女',
value:[4400000,2700000,1600000,380000,7000]
},
{
name:'男',
value:[4600000,2300000,1900000,420000,13000]
}
]
},

]

}
myChart.setOption(option)
</script>
</body>
</html>